 English
CFD Trading Tools
CFD Trading Tools
Every trader in the financial market must be armed with the necessary tools to succeed, and CFD traders are not an exception. The CFD trading tools can be described as resources that are designed to enable the trading of CFDs to be pleasurable and profitable for the CFD trader. To better understand what CFD trading tools bring to the table, it is best to visualize a war situation. No army goes to war with no tools or with the wrong tools and hopes to win. Likewise, CFD traders must be armed with the right tools. It is possible to try trading CFDs with the wrong tools, but wrong tools always bring wrong results.
One major factor that causes traders to work with the wrong tools is a lack of understanding of the entire market structure. CFD assets are divided into classes. What works for one class may not necessarily work for another asset class. For instance, the fundamentals that affect stock CFD prices are definitely not the same that affect cryptocurrency CFDs. Likewise, what affects cryptocurrencies CFDs cannot be the same as what affects commodity prices. Even within asset classes, there are differences between assets. So when it comes to CFD trading tools, there is no “one-size-fits-all” tool. Granted, there will be tools that can be applied across asset classes, but there will always be tools that can only be applied for specific assets.
CFD trading tools can therefore be divided into generic tools and specific tools. What follows below is a discussion of each of these groups of tools.
Generic Tools
Generic CFD tools can be applied to the trading of CFD assets across all classes. These tools will therefore include:
a) Interactive charts
b) Pivot point calculators
c) Trend lines
One thing that stands out is that these are all tools of technical analysis, and technical analysis works just the same way for all assets, irrespective of their class.
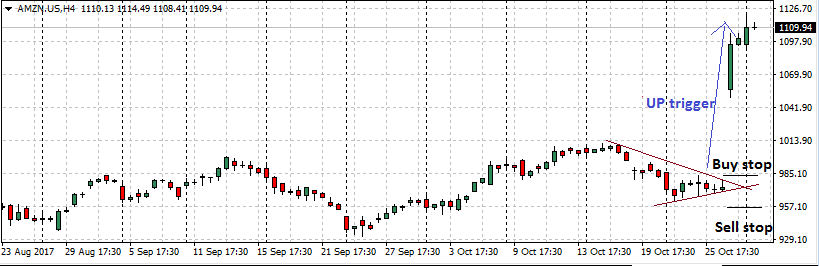
Charts are used to get price data, and also serve as an avenue for the application of technical analysis. Pivot point calculators are used to acquire daily levels of support and resistance for every single CFD asset. Trend lines are used to define support and resistance. All these tools can be applied on the same chart for all assets as illustrated below:
Specific Tools
Specific tools can only be used for one CFD asset class. They cannot be applied uniformly across all asset class. A classical example of this would be a tool that would prepare a schedule of earnings reports for companies quoted in the US markets. These assets are classified as stock CFDs.
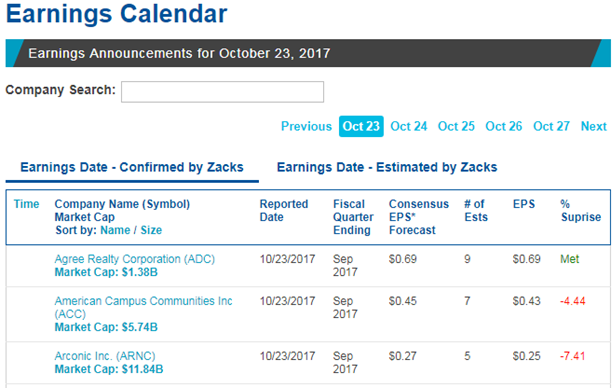
Earnings schedule (courtesy of Nasdaq.com)
The earnings schedule can be used to detect when earnings reports will be released. Due to the fact that stocks do not trade outside the trading hours, the trader can use stop entries on either side of the equation to pick a sudden gap in price if the earnings beat expectations (upside trigger) or disappoint the market (downside trigger).
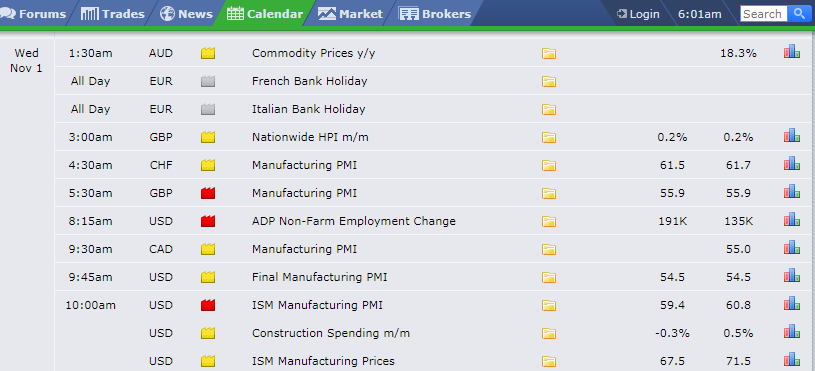
Another tool specific to the forex market is the economic news calendar. This calendar details the schedule of economic data that showcase the health of various sectors of the economies represented.
Forex news calendar (forexfactory.com)
The discussion of CFD trading tools will continue in the second part of this article.